Machine learning-based evidence and attribution mapping of 100,000 climate impact studies
This text and the accompanying graphs are based on the analysis performed for the paper published as Callaghan, M. et al. (2021) Machine-learning-based evidence and attribution mapping of 100,000 climate impact studies, Nature Climate Change, doi:10.1038/s41558-021-01168-6
We use machine learning to identify over 100,000 individual studies of
observed climate impacts, and classify the type of impact they document, and the
climate variable driving these impacts. Identifying relevant documents was a difficult classification
problem (for humans as well as our machine learning model) so there are large uncertainties around
the number of relevant documents, but we know that that this number is large and growing.
Assessing evidence at this kind of scale manually is unfeasible, but mapping this out is critical to
assessments like the the IPCC which try to provide a comprehensive picture of climate research.
We use machine learning to predict what type of system climate impacts are occuring in, whether those
impacts are being driven by temperature or precipitation, and where the study documents evidence from.
The studies we include describe impacts that may not be formally attributed to human influence on the climate.
Many studies look at the effects of rising temperatures on an outcome like heat related mortality, for example,
without necessarily establishing - in the same study - if this rise in temperatures is formally
attributed to human influence on the climate.
However, we can use other methods to establish where changes in temperature or precipitation have risen,
and to attribute these changes to anthopogenic warming.
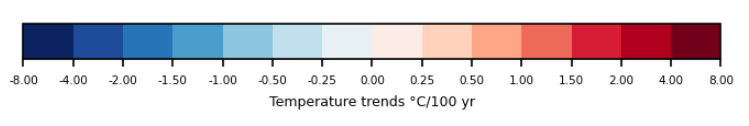
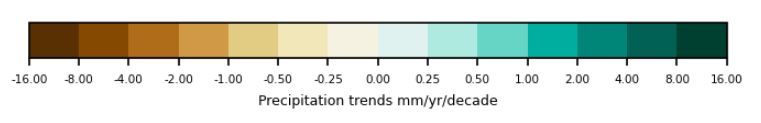
We used updated observational data and recent climate models to generate a picture of where trends in temperature and precipitation since 1951 can be
attributed to human influence on the climate.
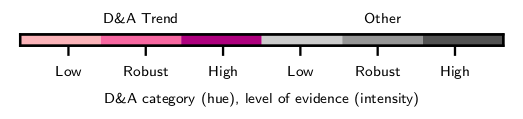
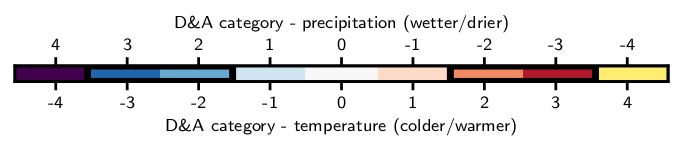
Where trends are significantly different from internal variability, and in line those expected from climate models, we call them
detectable and attributable trends (attribution categories +-2/3 below)?
Temperatures have been rising all over the world, and for the majority of land area, these can
be attributed to human influence on the climate.
Attributable trends in precipitation are visible for a much smaller percentage of the world.
Sometimes this is due to a lack of data, sometimes this is due to the observed trend not diverging
from natural variability, and sometimes this is because climate models predict a trend in the
opposite direction (categories +4 and -4).
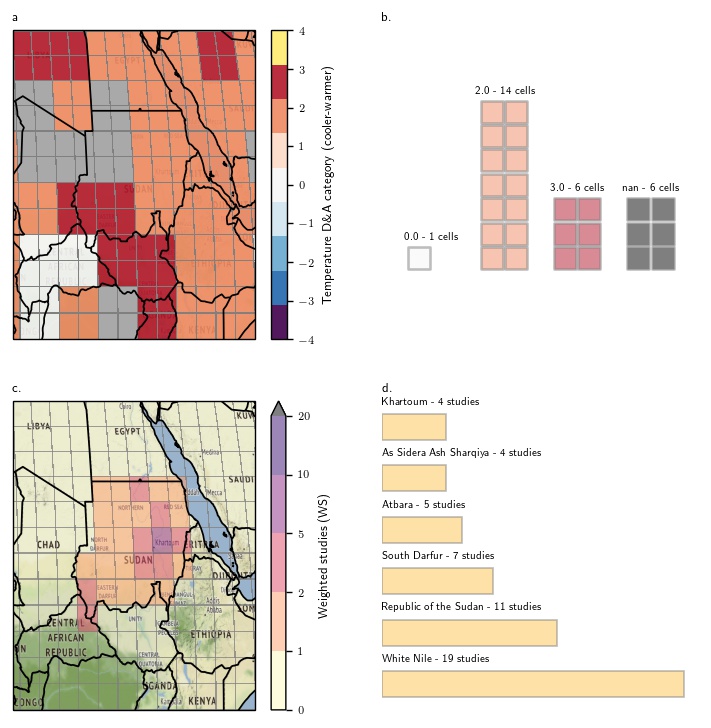
Next we map the studies we identified to the same grid cells by resolving the locations we identified
to the set of cells that overlap the location. The example below shows how the the grid cells attribution
categories are aggregated for a given geographical location like Sudan (a. and b.), and how
the studies that talk about Sudan and the geographical locations within Sudan
are mapped to grid cells with a Weighted Studies (WS) score.
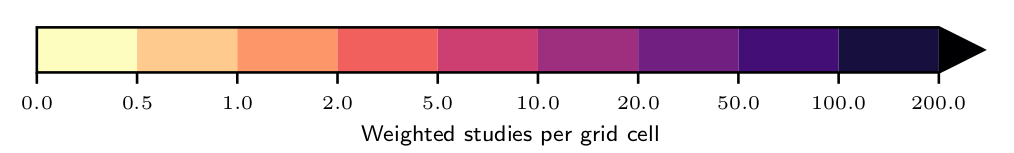
By plotting this weighted studies score in each grid cell, we can show where evidence on climate impacts
is the densest, and see how this changes when we look at different types of impacts, and different drivers.
The darker parts of the map below show where there is the most evidence on climate impacts, for example over
Europe.
If we overlay the two maps we have already seen, we can bring together the two lines of evidence and show
1. A growing body of evidence on climate impacts
2. Automatic classification and mapping of evidence
3. Grid cell level attribution of temperature and precipitation trends
4. Mapping individual studies to grid points
5. Mapping climate impact research by impact type
6. Mapping potentially attributable impacts literature through preliminary two-step attribution
Bringing these lines of research together, we can show the extent to which the impacts
of climate change are being felt across systems and across continents